
10 Apr 2026 • 4 min read

Google Search Ad Benchmarks NZ 2026
[2026 Updated]
If you are investing in Google Search Ad campaigns, it's essential to know whether your efforts are paying off. But what constitutes a successful campaign? The answer isn't one-size-fits-all. A high-performing metric in one industry might be considered mediocre in another. So, how do you determine the benchmark for success in your specific industry?
Every year, we analyse aggregated, anonymised results across our clients to get a true pulse on the digital advertising landscape. We focus on key Google Ads metrics:
We’ll provide insights across four main industries - E-Commerce, Financial Services, B2B/SaaS, and Consumer Goods & Services. So, whether you're new to Search Engine Marketing (SEM) or looking to improve your current strategies, these benchmarks will help you assess where you stand and what to improve.
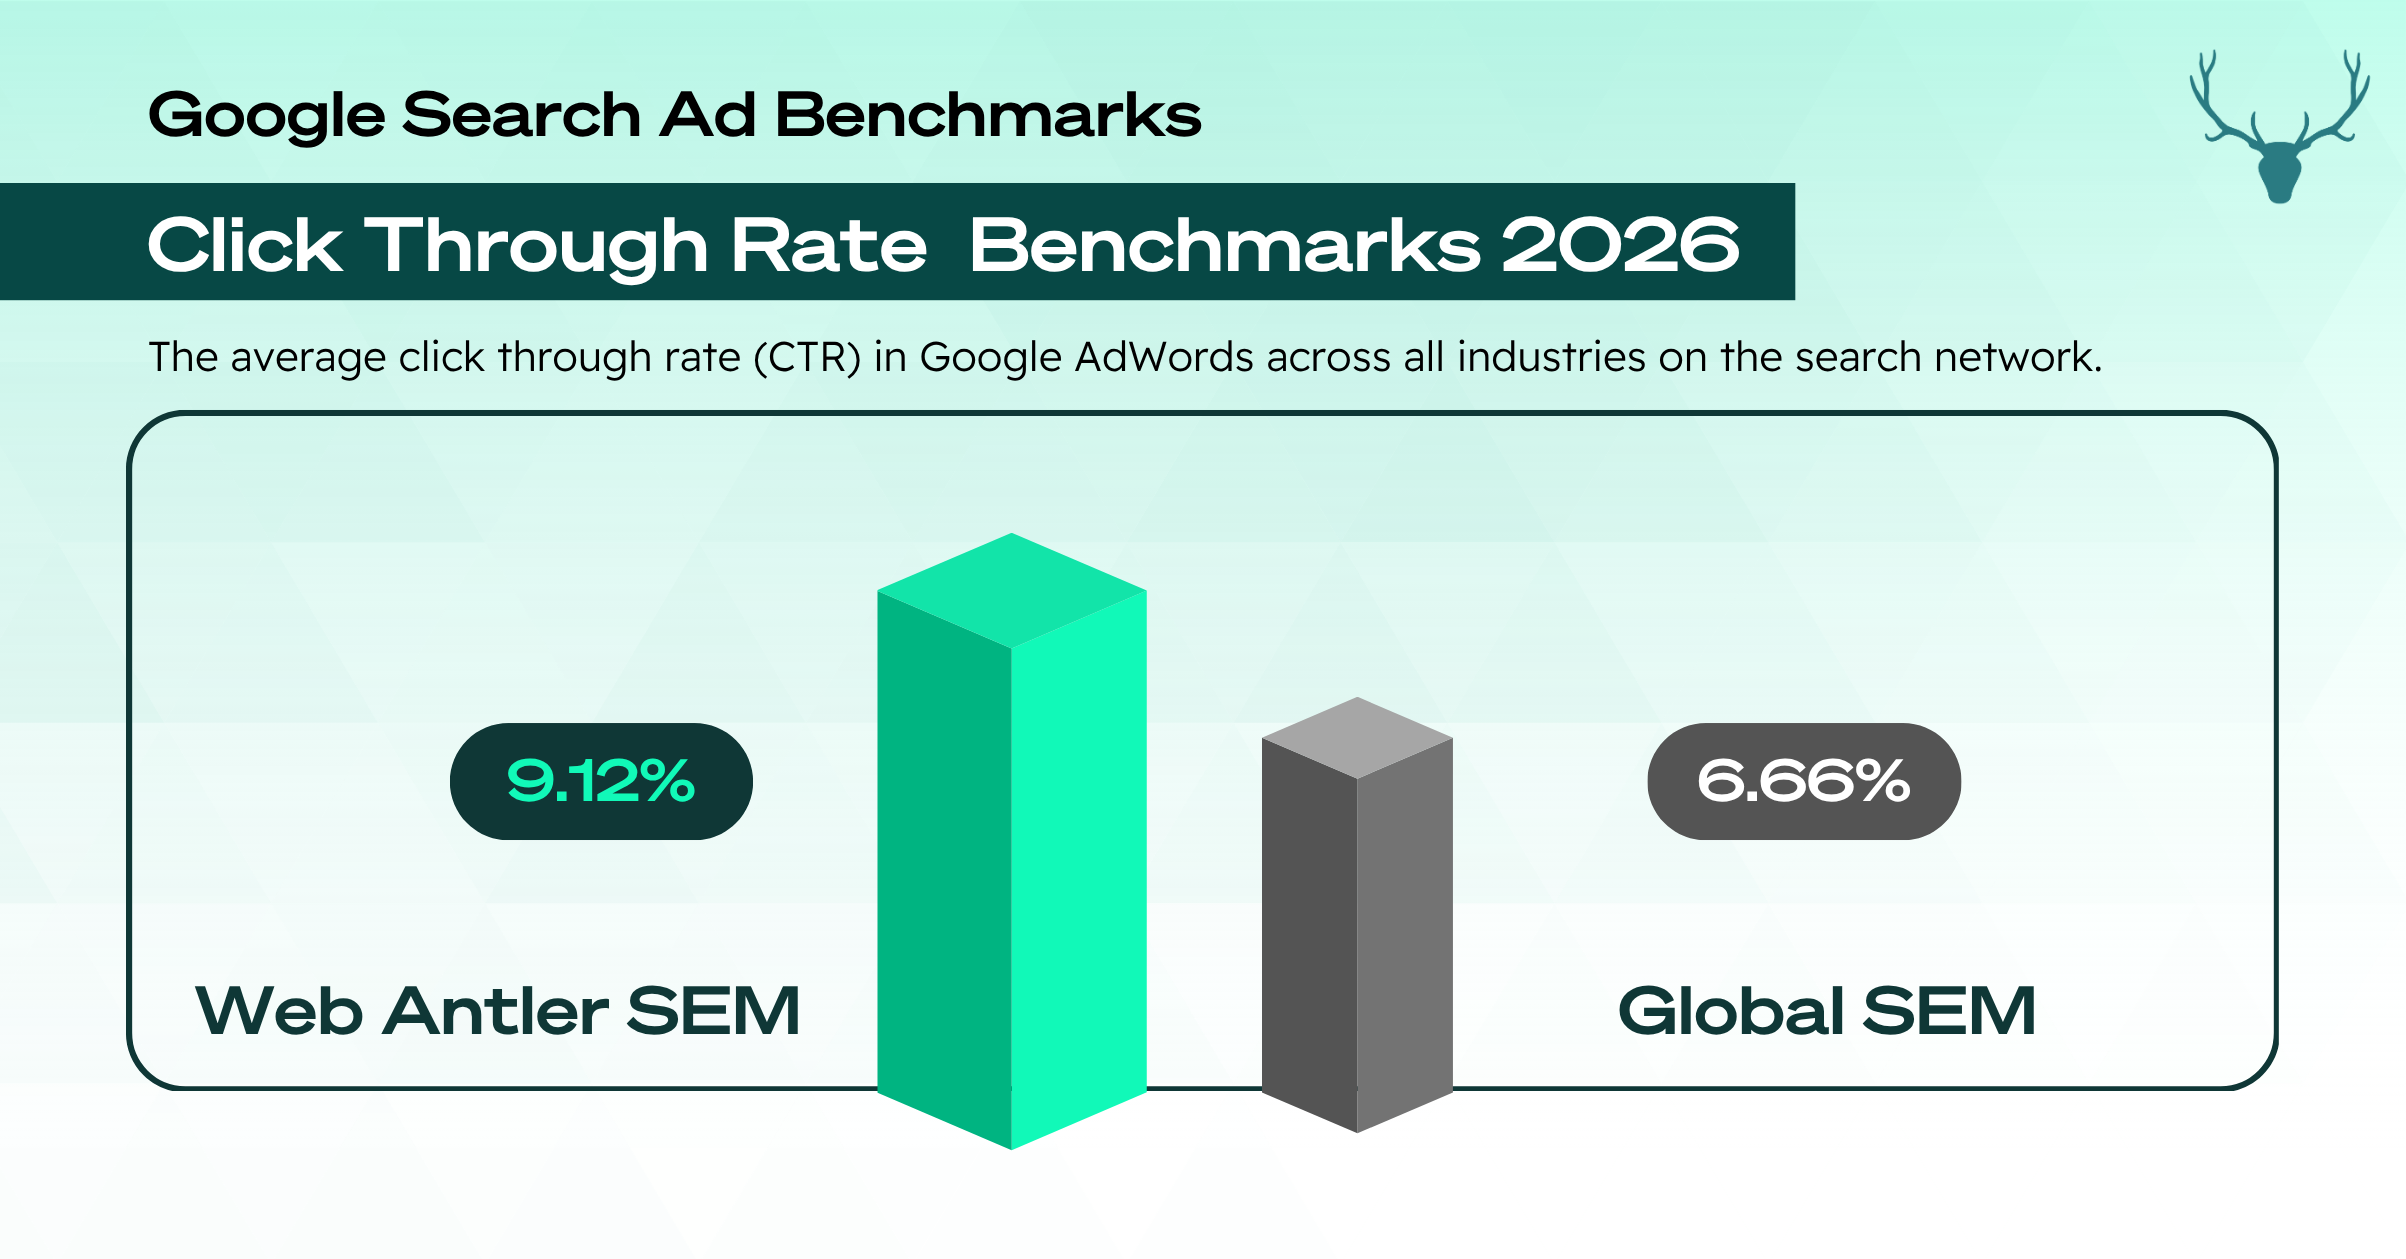
Understanding Click-through Rate (CTR) is fundamental to any Search Engine Marketing (SEM) campaign – a direct reflection of your ad’s relevance and appeal to your target audience. The higher the CTR, the more compelling and effective your ads are.
In the graph, you’ll see a side-by-side comparison of our New Zealand average CTR (9.12%) against the global average (6.66%). CTR will naturally vary across industries, driven by how well ads are aligned to specific audience intent.
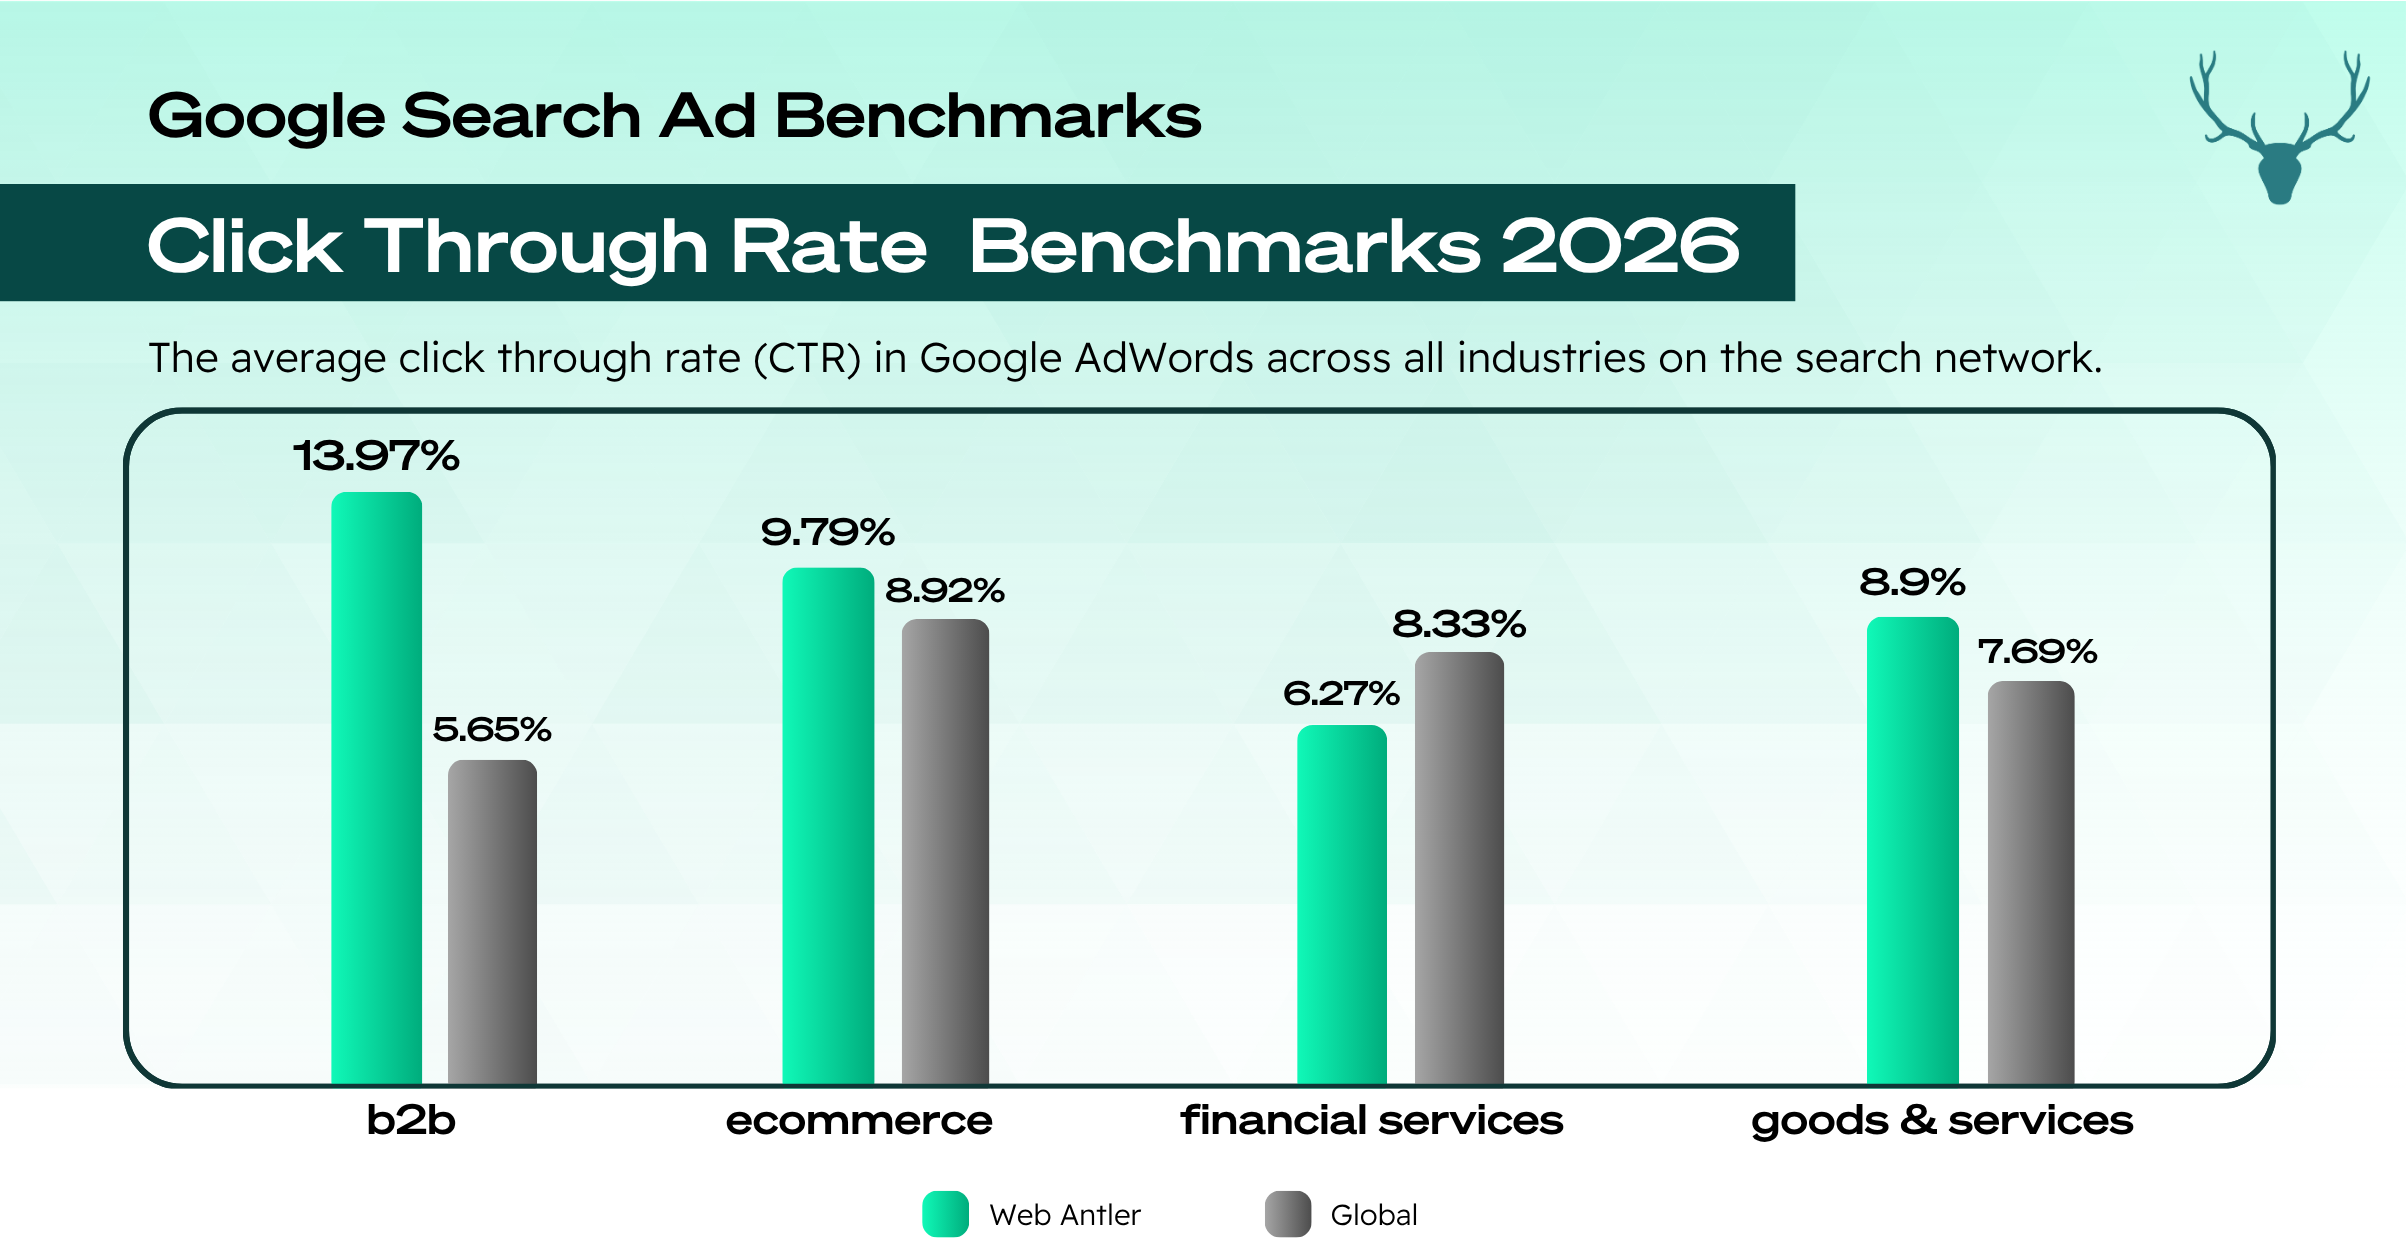
In this next graph, we dissect the data further, presenting a comparative analysis of the average New Zealand Click-Through Rate (CTR) across four key industries: B2B/SaaS, E-commerce, Financial Services, Consumer Goods & Services. Each industry's CTR is juxtaposed against the corresponding global benchmarks.
Remember that these averages are just benchmarks, and results can vary based on numerous factors, such as the quality of your offerings, the competitiveness of your market, and the effectiveness of your overall marketing strategy.
The takeaway? Strong creative and targeting can consistently outperform international norms when backed by deep local insight and campaign testing.
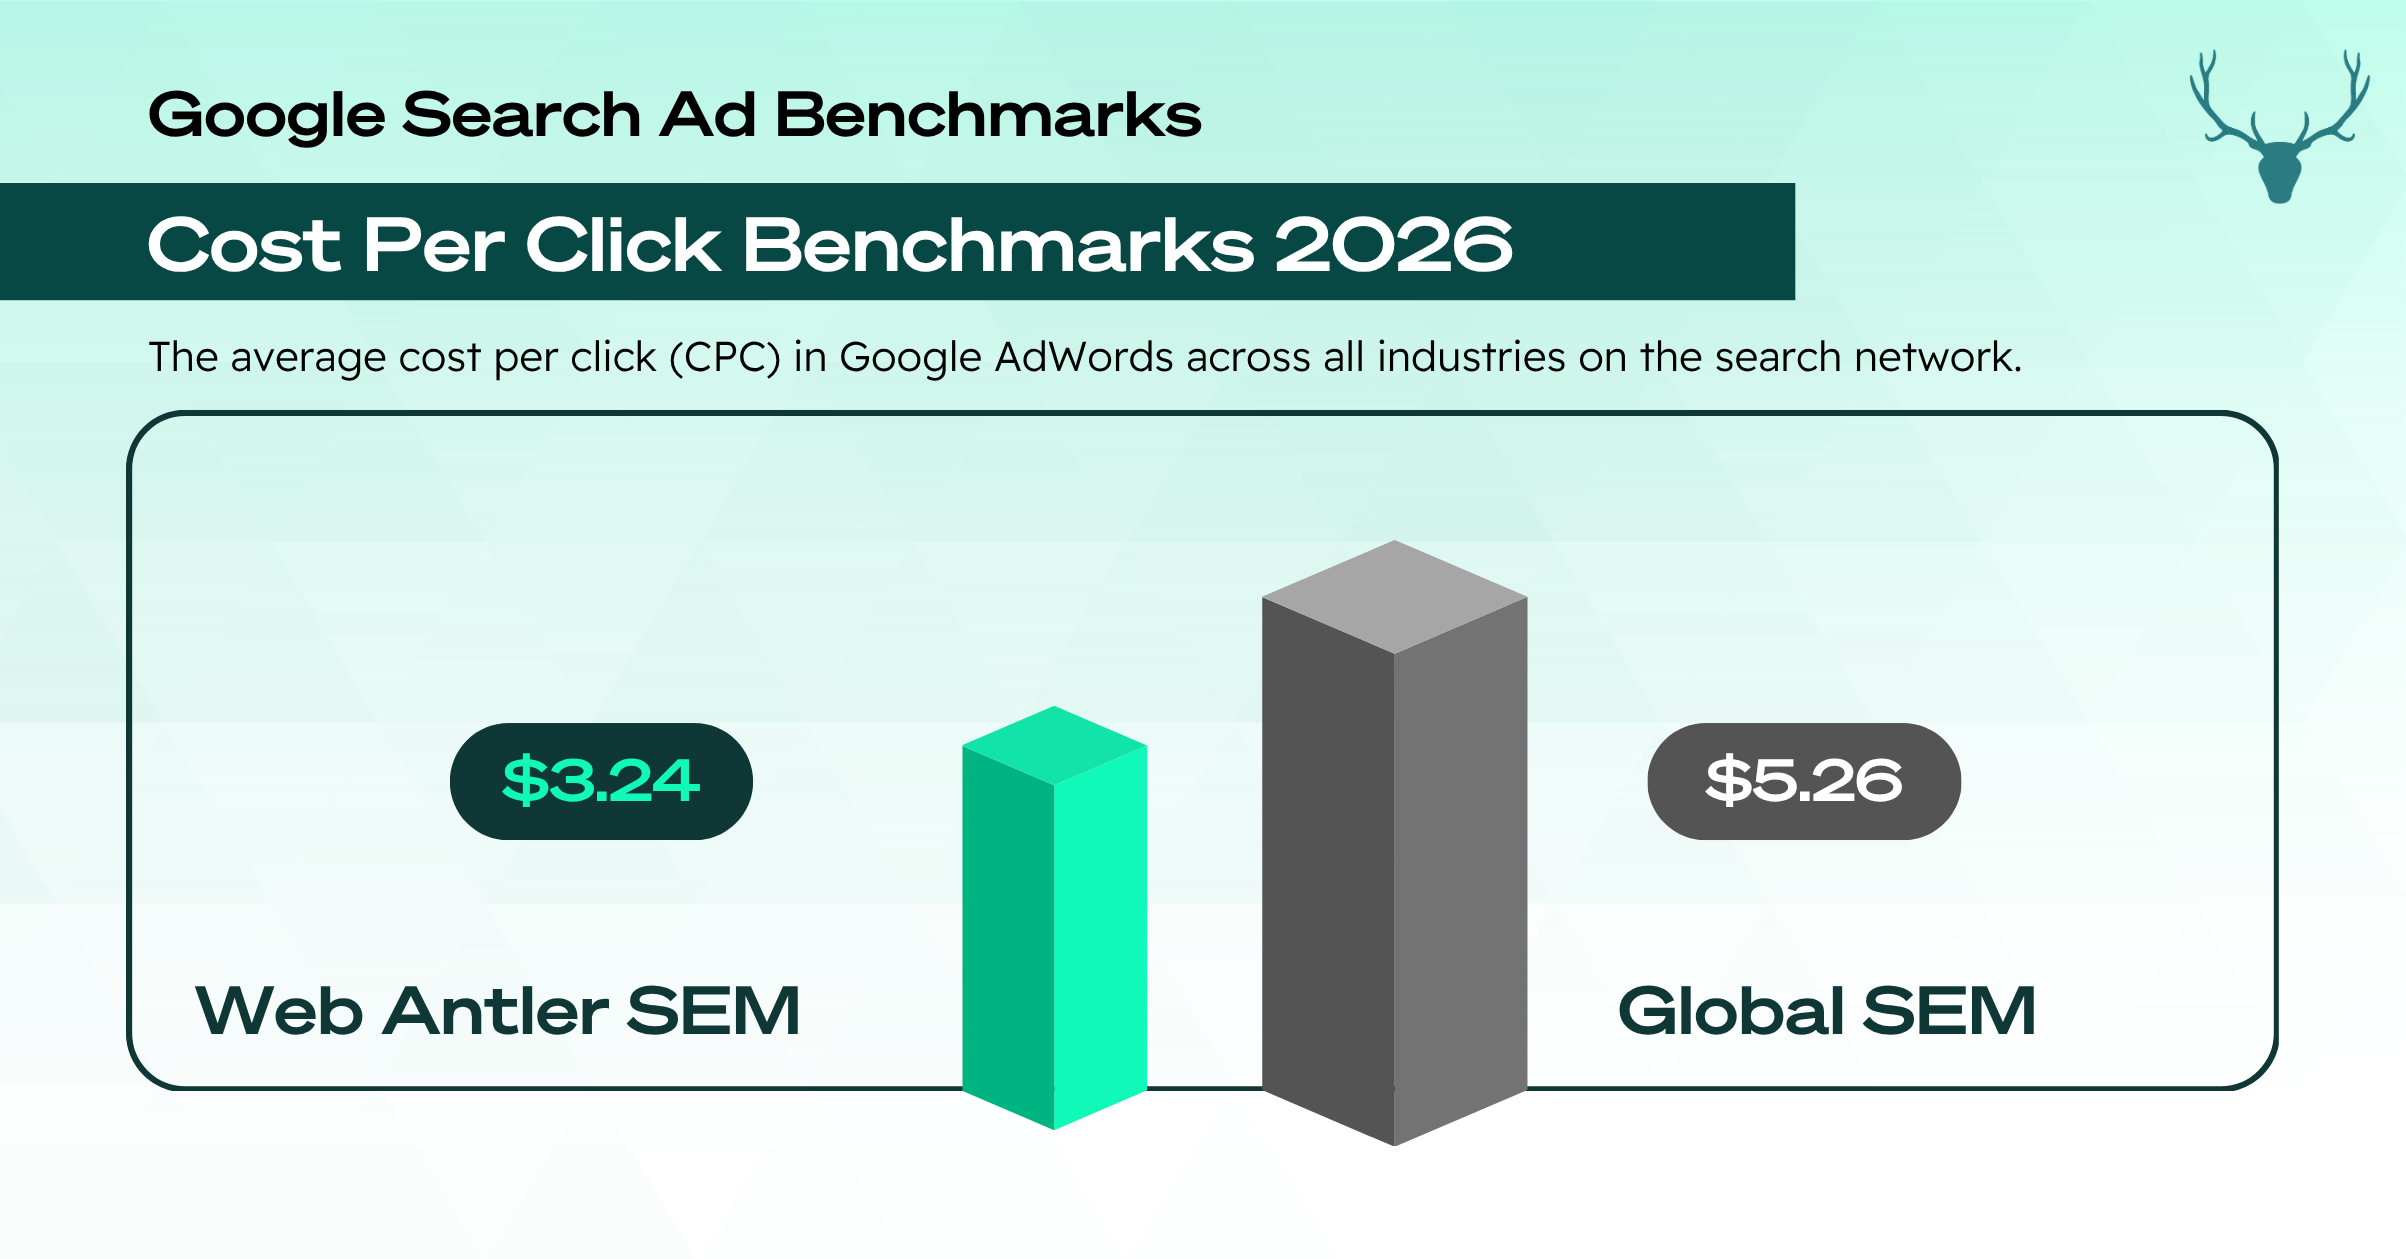
Next, we delve into the realm of Cost Per Click (CPC). CPC reflects how much you pay for each visit to your site – a key measure of cost-efficiency. Our average New Zealand CPC stands at $3.24, much more cost efficient compared to the global average of $5.26.
Remember, these figures are averages, and actual CPCs can vary depending on factors such as industry competition, quality of ad copy, and the relevance of your keywords to your ad group and landing page.
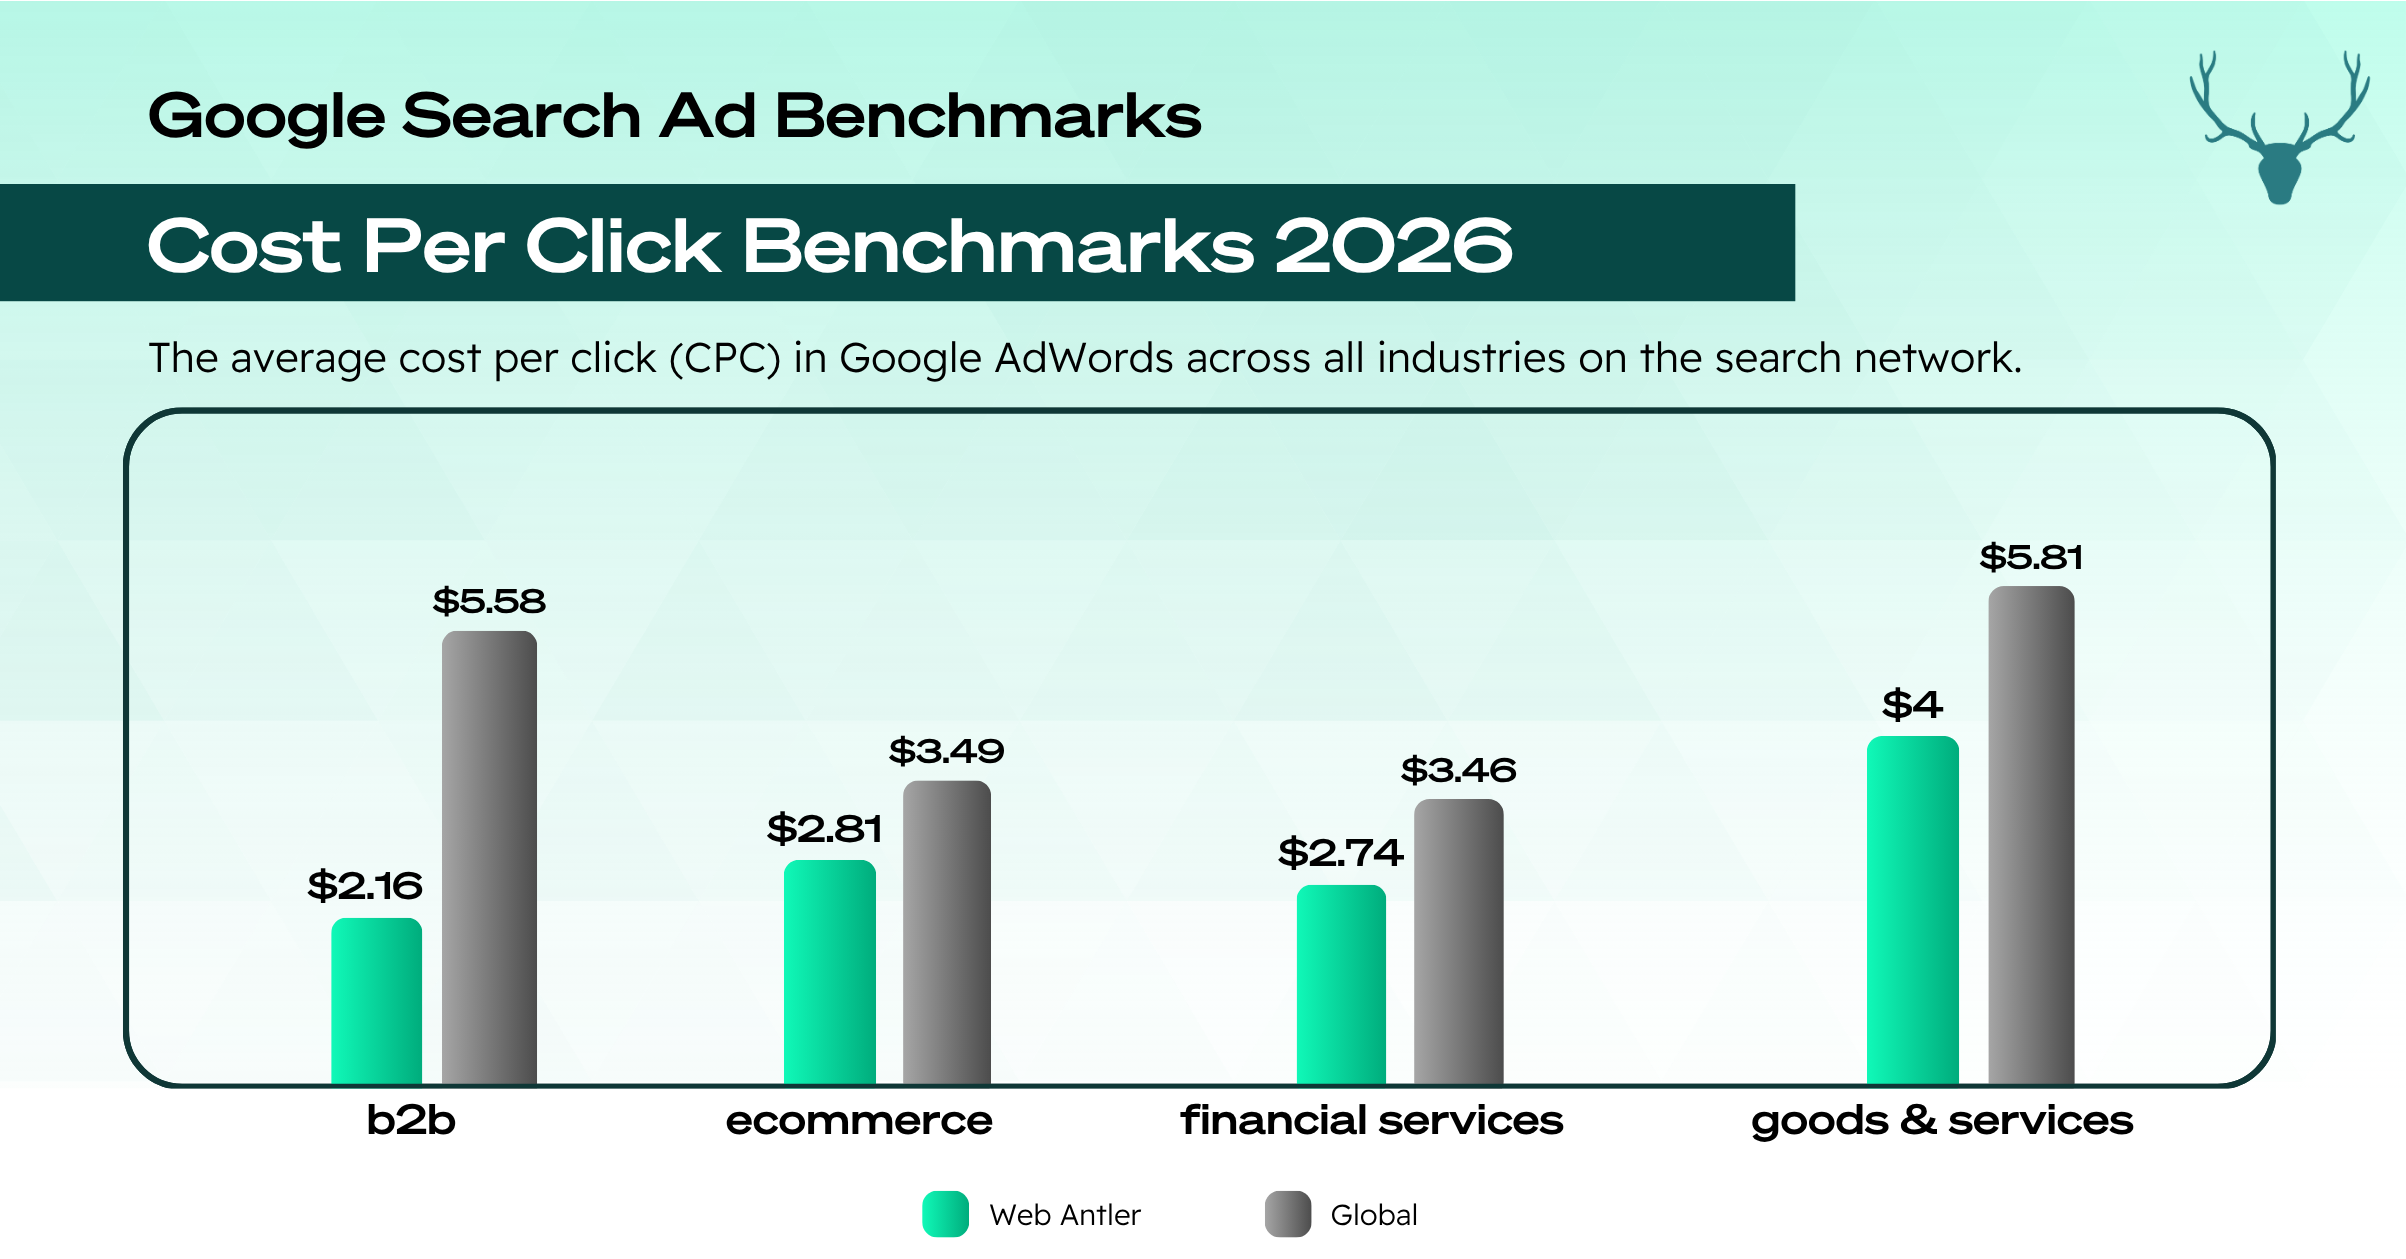
The above graph shows the Cost Per Click (CPC) performance across various New Zealand industries, showcasing we’re constantly holding our own in highly competitive sectors.
New Zealand B2B advertisers continue to benefit from significantly lower CPCs compared to global benchmarks – a clear edge for local brands executing smart, intent-led SEM strategies. In contrast, E-Commerce and Financial Services are much closer to global averages, reflecting heightened competition. Each industry demands its own approach. Whether it’s lowering acquisition costs in retail or maximising ROI in high-value B2B leads, success hinges on smart bidding, audience insight, and campaign precision (not just CPC alone).
CPC isn’t just about cost, it’s a window into how well your investment strategy aligns with user intent. Efficient CPCs are a sign of campaign health, not just cost savings.
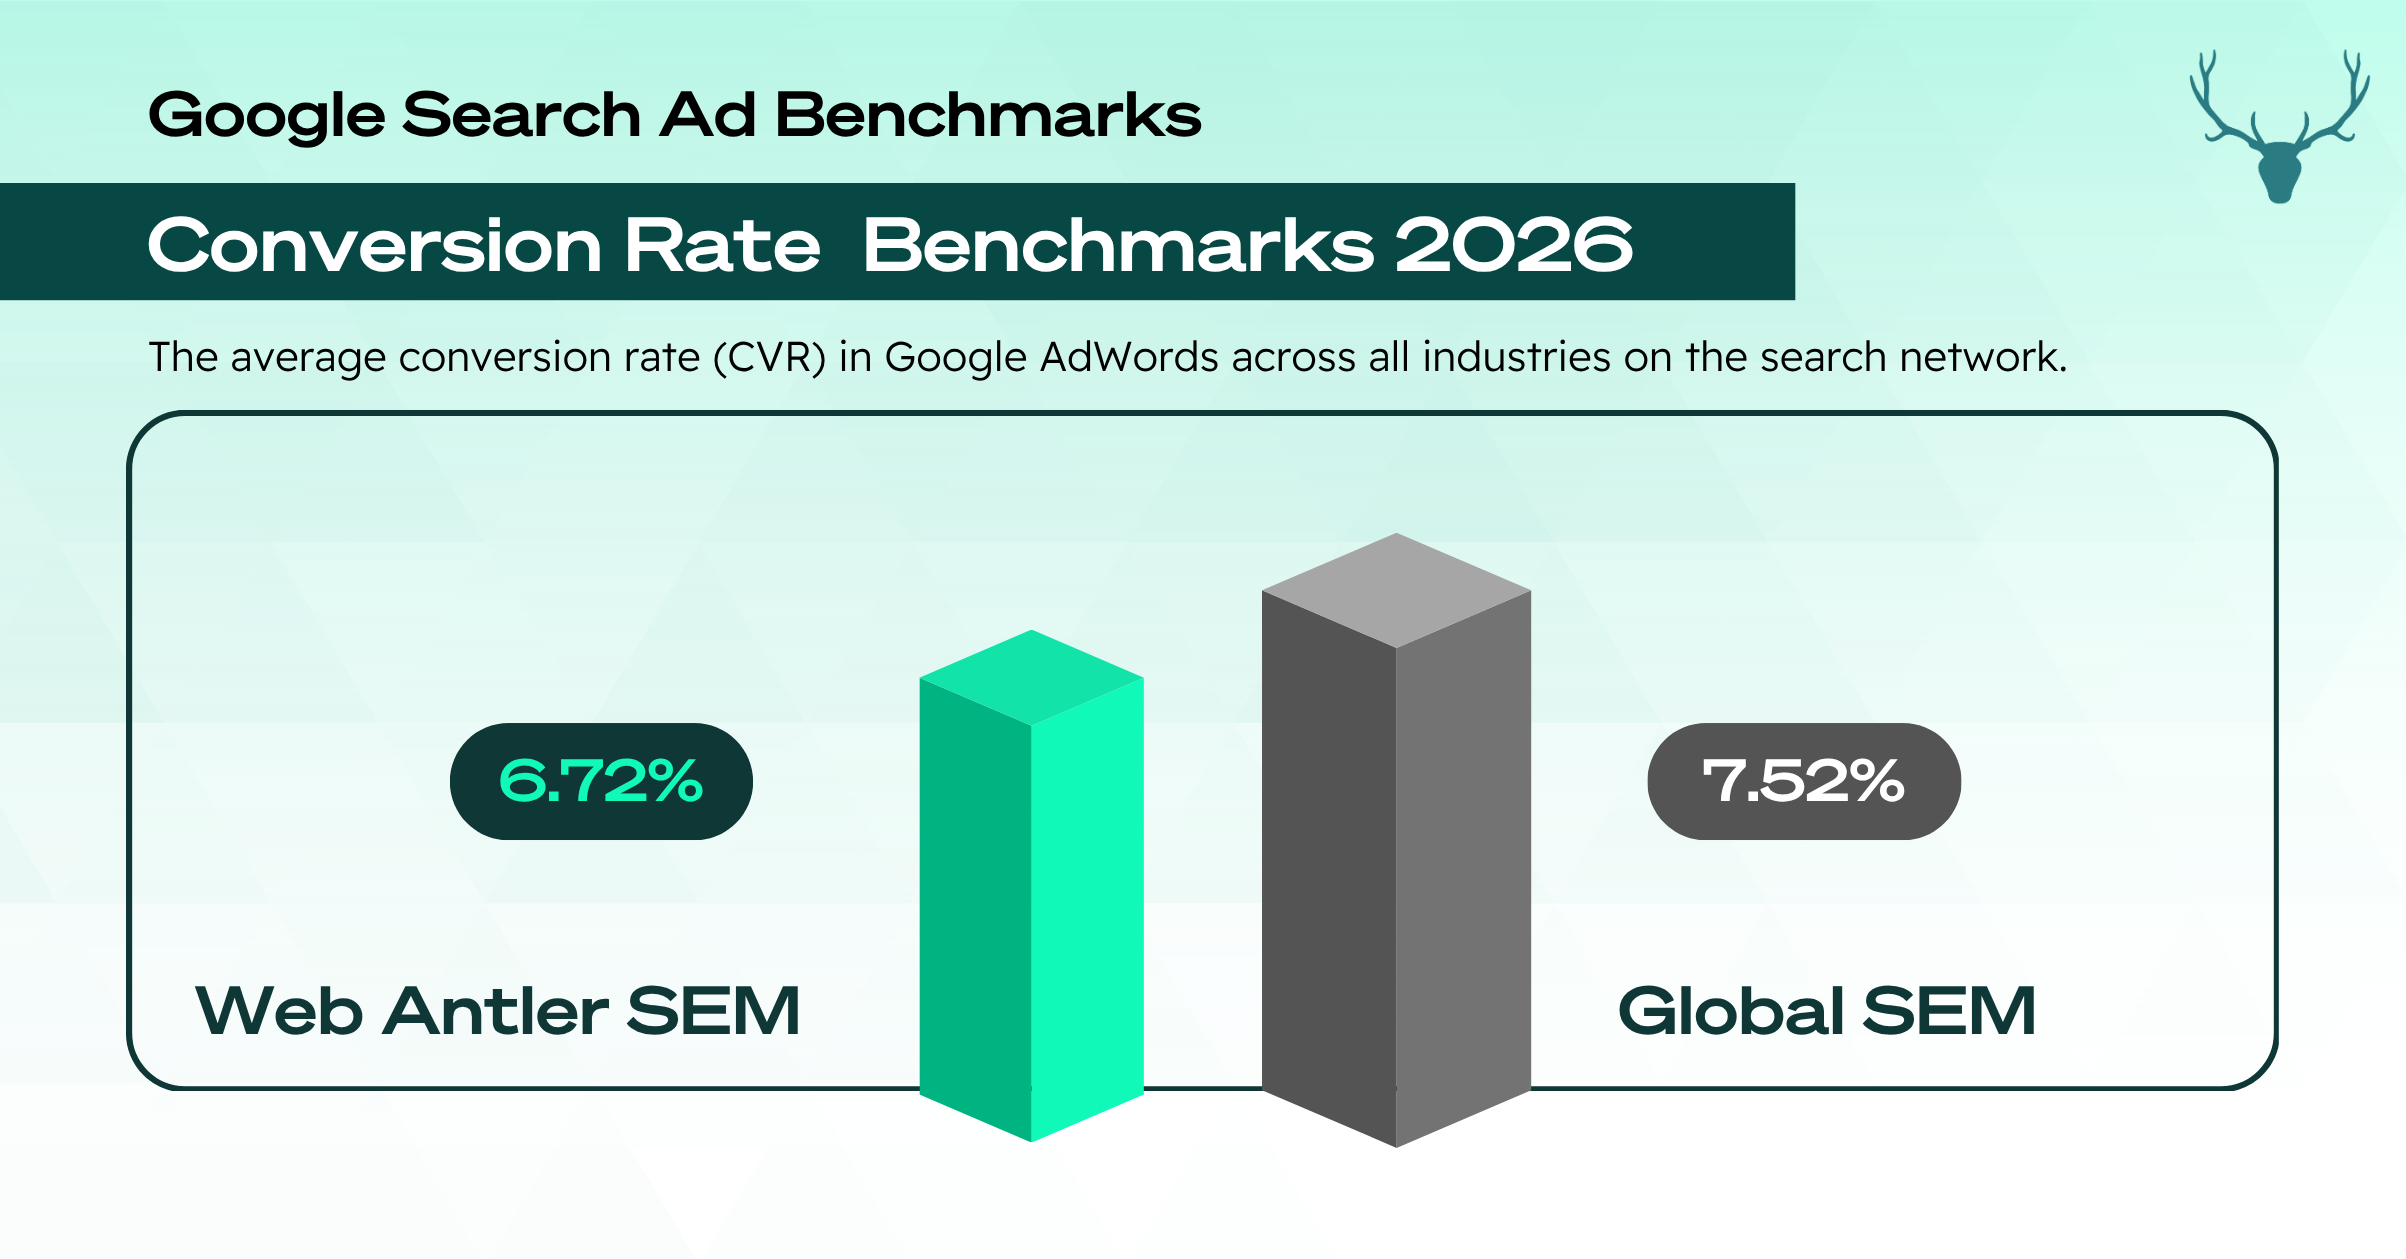
Wrapping up our benchmark performance, we turn our focus to one of the most significant metrics of any SEM campaign - the Conversion Rate (CVR). This metric is critical as it reveals how effectively your ad campaigns are converting visitors into actionable leads or sales (calculated by the percentage of people who click an ad and go ahead and convert). It’s the clearest measure of whether your ads and landing pages are doing their job.
Web Antler’s overall New Zealand Conversion Rate stands at an impressive 6.7%, one point behind the global benchmark of 7.5%. If your lead rate or conversion rate falls short, it’s worth reviewing your message-to-market fit, your offer clarity, and your post-click experience.
Remember, conversion rates can vary drastically, depending on how easy the conversion point is (for example a PDF download conversion will have a considerably higher conversion rate compared to more complex conversions such as filling in a lengthy form).
The true measure of success will always depend on your unique business goals and KPIs. The most successful campaigns prioritise conversion quality over quantity. Focus on meaningful outcomes, not just volume. That's why at Web Antler, we create you a custom SEM strategy to meet your specific needs, combining industry knowledge with a deep understanding of your business to deliver a campaign that drives real results.
Do these figures include branded keywords or just generic keywords?
The figures omit advertisers who were exclusively bidding on branded term
What is the Global data?
The Global data is reflective of a sample of US-based accounts. Global Benchmarks are derived from WordStream benchmarks
What currency is the Global Cost per Click in?
We have taken the global USD benchmarks and converted to NZD
Could you take a look at my Google Ads Account?
Yes, we are open to having a discussion around your current performance and areas where you can improve. If you would like to know more, please see our Google Ads Management Services.